For everyoneReports + Dashboard
See what actually moved.
Reports turn Meta results into a clear story: spend, results, and cost per result, day by day and by age, gender, country, and placement. Then share a read-only report with your client.
What you get
Everything in the box.
- 01
The headline numbers
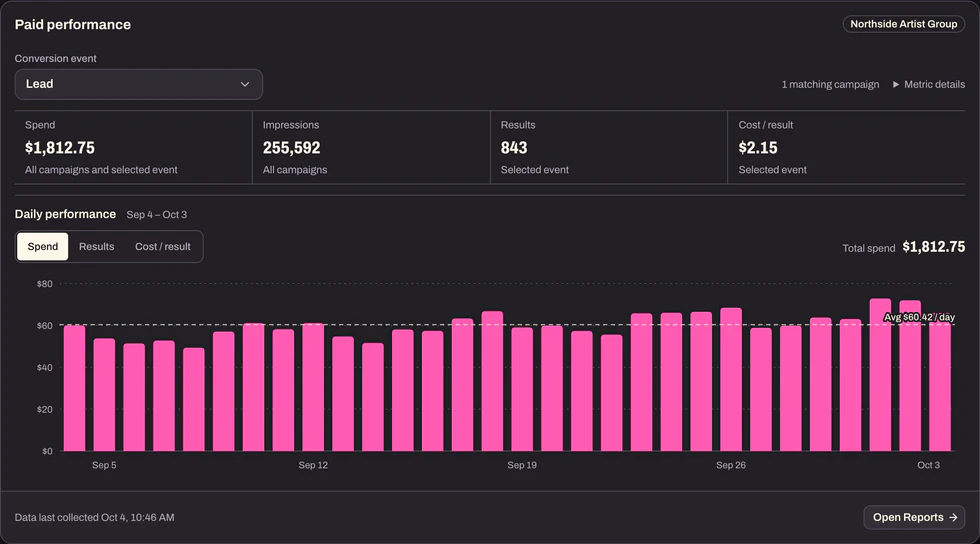
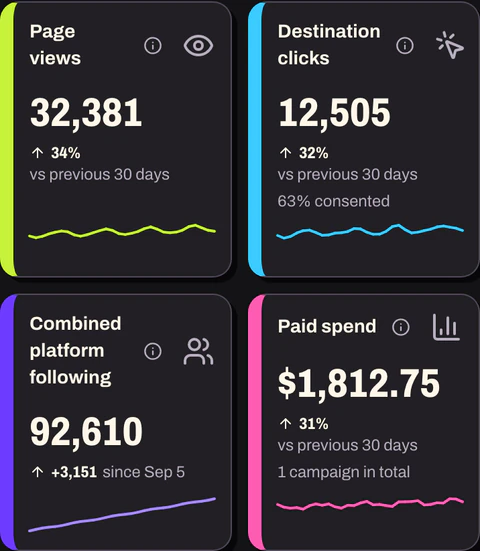
Spend, results, cost per result, reach or impressions, click-through rate, and CPM for the campaign and date range you pick.
- 02
Your result, your call
Choose the conversion event that counts as a result, like leads, and cost per result follows it.
- 03
Day by day
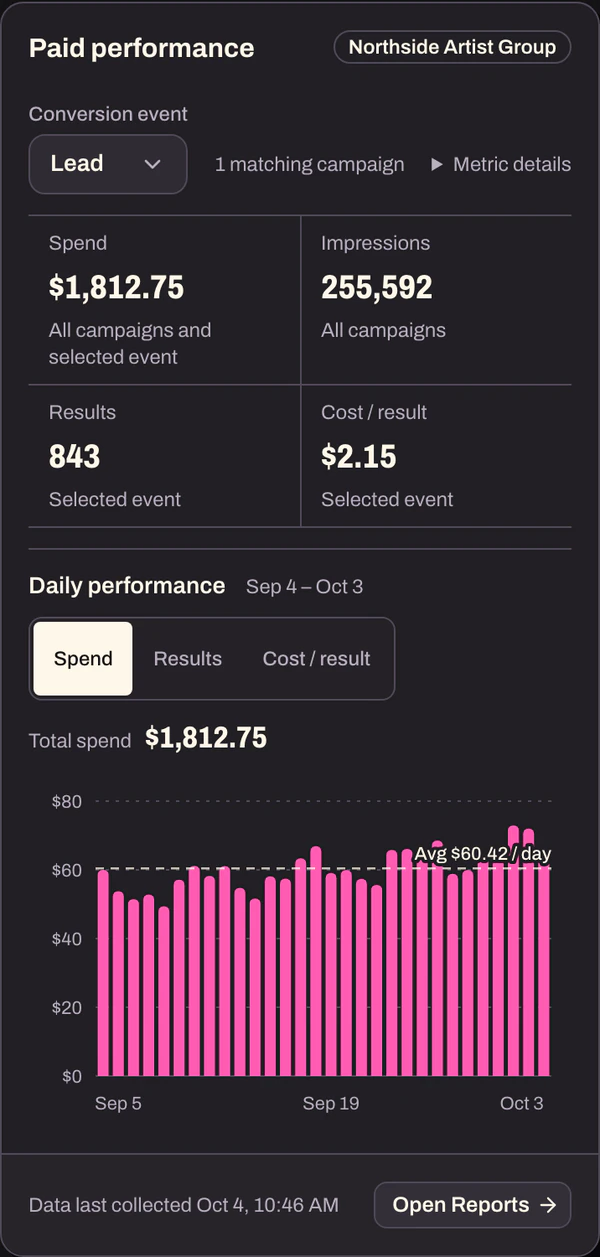
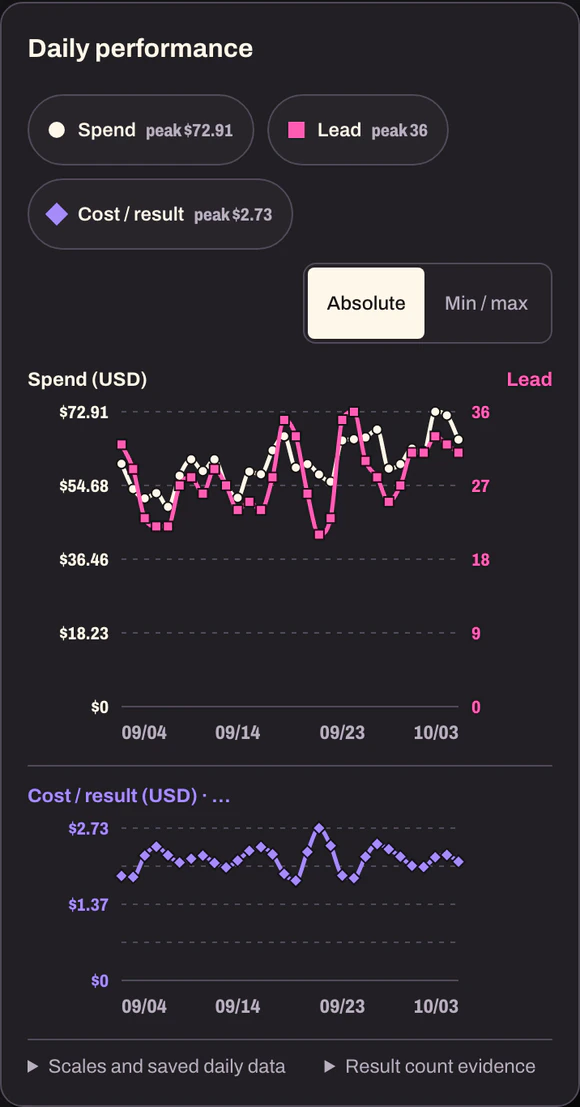
A daily chart of spend, results, and cost per result shows what changed and when.
- 04
Break it down
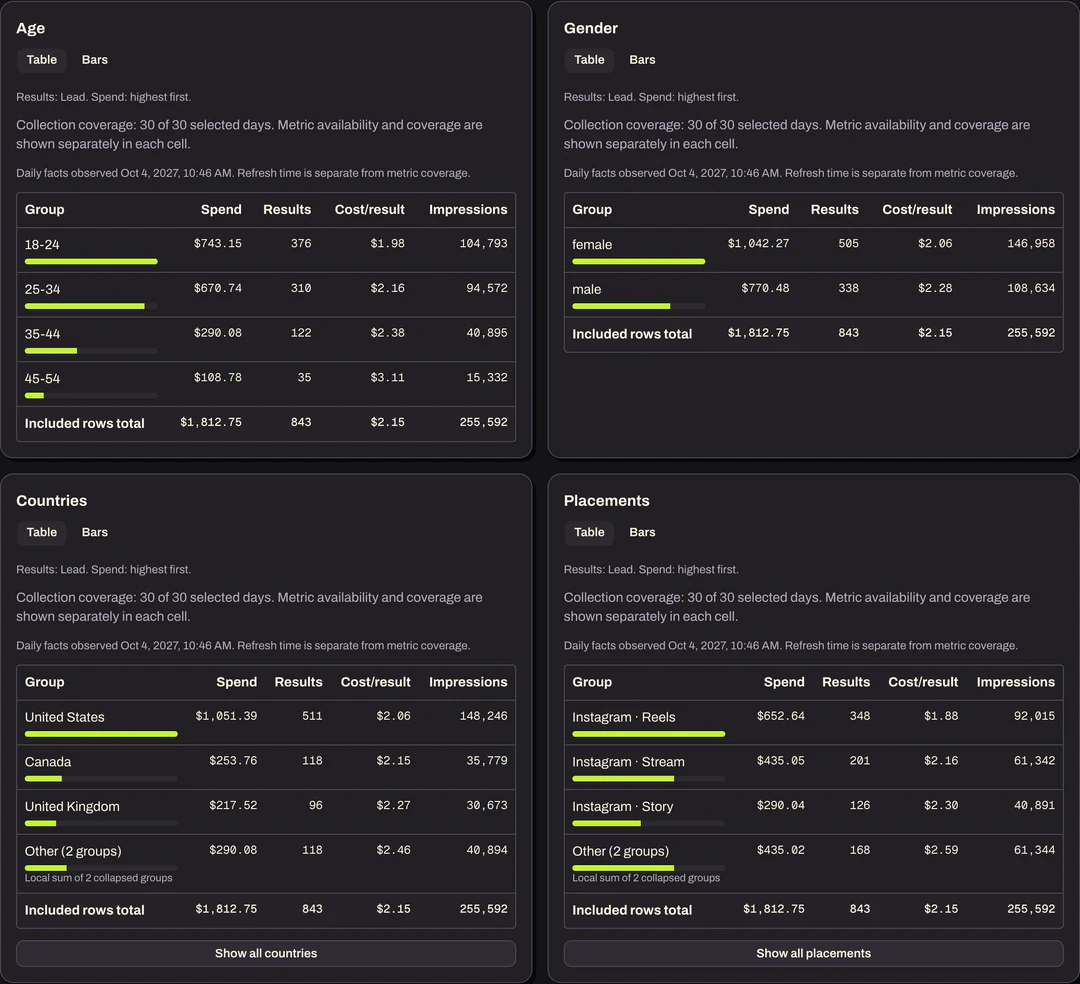
Split a campaign's performance by ad set, ad, age, gender, country, and placement.
- 05
Client reports
Share a read-only link with headline results, the daily trend, a comparison with the previous period, and the audience. No login needed.
- 06
Scheduled delivery
Send clients a report link on a schedule you set when there are new results.
- 07
Performance alerts
Get alerts for cost spikes, pacing, and delivery problems.
How it works
Four steps.
No spreadsheets.
- 1
Connect your Meta ad account.
- 2
Pick a project, a date range, and the result you care about.
- 3
Dig into the breakdowns.
- 4
Share a client report with a link.